For many Power BI Reports, especially those that are business focused, a date table (calendar) is absolutely vital. Date tables are necessary for a number of reasons. Chief among them is the ability to employ the many useful prebuilt date-time functions in DAX. Date tables may be necessary to join fact tables and are integral to aggregating data into months, quarters and years.
There are several ways to bring in date tables: build in excel and import into Power BI, use DAX formulas to add a table in Power BI Desktop or import a table from a SQL database. As an Excel user, for many years I used data tables that I’d built in Excel. Recently, however, I’ve been using Power Query to construct my date tables. One of the reasons I’ve come to prefer Power Query (PQ) is that it’s really easy to add all the columns I need by making use of the “add-columns” functions. In fact, to build this simple date table, I only need to remember one formula (= List.Dates). In less than 5 minutes, I can add all the additional columns I need for a fully functioning date table.
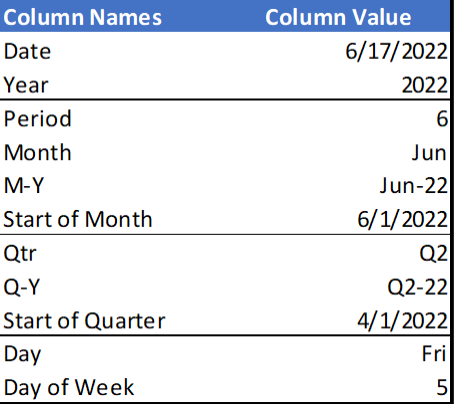
The figure shown below shows the columns, which I’ve split into 4 sections. The first section contains the most basic date columns, Date and Year. Section two is the month section, with the numeric Period column, the first 3 letters of the Month Name, M-Y which concatenates Month and Year, and Start of Month, which is used to sort the M-Y column into chronological order. Section 3 contains quarterly columns, including Start of Quarter which, again, is used to order the Quarter-Year Column (Q-Y). The final section has Day (first 3 letters) and Day of Week.

How to Build the 5-Minute Date Table
As I mentioned above, there’s only one formula that you’ll need to remember for this table. Why is that significant? It’s because for Excel users and non-coders, the M Language which is used with Power Query, is not at all intuitive. So, maximizing the use of PQ’s add-column functionality and minimizing the need to write code is a great way to start using Power Query in your reports.
To begin, open a new “Blank Query” data source and type =List.Dates. Click on the check mark which saves the code and brings up a Parameter input tool.

Three values need to be entered into the parameter input tool. The start date, the count (of periods) and the step, which is the number of days in each interval. In this example, I want to build a 3 year date table from 2020 to 2022. The three values that I enter are
Start: 12/31/2019
Count: 1096
Step: 1

Note: I start 1 day before 1/1/2020 in order to make use of PQ’s Column from Examples functionality.
Once the parameters are entered, select invoke and a column appears. Press the Convert To Table button in the upper left and a 1 column table is created.

The toughest part is over. From now, you can just use the different Add Column functions to build out the table.
The most useful function for building date tables is located on the Add Column ribbon, as shown below. This Date button contains more than 25 different date functions. Once the initial date column is in place, adding additional columns with the Date button is simple and fast.

Another great way to add columns in Power Query is using the Add Column From Examples. In the screenshot below, in the Custom Column I typed “Dec-19” and then “Jan-20. Based on those two entries, Power Query was able to recognize the pattern and generate the appropriate code. Broken down, the code reads as follows:
Text.Start([Month], 3): fetches the first 3 characters from the Month column
“-“: inserts a hyphen
Text.Middle(Text.From([Year], “en-US”), 2): gets the last two digits from the year column and renders them as text in the English-US format.
Text.Combine: works much like the CONCAT formula in Excel to combine all the different elements of the formula.
The complete formula, shown here, is generated automatically, which from my perspective is amazing.
Text.Combine({Text.Start([Month], 3), “-“, Text.Middle(Text.From([Year], “en-US”), 2)})
Power Query’s ability to create this code from just 2 examples is amazing. As a side note, the reason why I start with 12/31/2019 is because PQ needs the variation (Dec-19 and Jan-20) to recognize the pattern.

Once I’ve added all the columns I want, there are two final steps. The first is to change the start date from 12/31/2019 to 1/1/2020. The second is to write the List.Dates function directly into the table, rather than using reference to the Query. In Advanced Editor, these changes are very quick; simply type “List.Dates” in place of Query1 and “2020, 1, 1” in place of “2019, 12, 31.” The Query1 function can then be deleted.
Before Code change in Advanced Editor

After code change in Advanced Editor

Click here to access the M Code that was used to create this table.
Instructional videos can be found on YouTube and TikTok.
Comments