Concept 5: Calculated Columns versus Calculated Measures
Concept 5: Calculated Columns versus Calculated Measures
In Power BI, there are 2 types of formulas - calculated columns and calculated measures (also called measures), both of which are written in a language called DAX. Understanding the difference between the two calculation types and when each should be used is quite important. Excel users, when they first begin using Power BI, tend to rely too much on calculated columns. More detail on the reasons for this will be discussed in a subsequent post.
Calculated Columns
A calculated column inserts a new column into a table. Calculated columns operate at the row level, meaning that each row in the column is calculated invidually. As shown below, a calculated column, Margin, is obtained by subtracting COGS from Actual Sales, with the DAX formula as follows: 'Sales'[ActualSales] - 'Sales'[COGS].
Figure 1: Margin as a calculated column

As the example above demonstrates, margin can be revived as a calculated as a column. The question, though, is whether it should be done that way, or whether it’s better to use a measure?
Calculated Measures
Measures, at their most basic, perform operations on an entire column. For instance, Sales sums the entire column. More complex measures include operations such as dividing one measure by another. The table below illustrates 3 variations of a measure; first is summing columns, the second is subtracting one measure from another, the third uses the DIVIDE function to obtain % COGS and % Margin.
Figure 2: DAX Measures

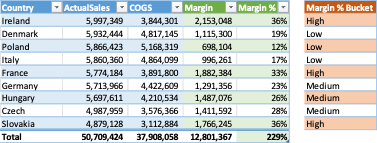
Returning to the question posed above, when should a measure be chosen over a calculated column, the simplest answer is this: if a measure CAN be used, it should be used. In Figure 3, below, Margin % is shown as a calculated column. For individual countries, the Margin % figures make sense. However, the Total, at 229% is incorrect and misleading. 229% is the sum of the Margin % for all countries, rather than the result of dividing total Margin by total sales (25.2%). Using measures instead of calculated columns lowers the chance of producing confusing or incorrect answers.
Figure 3: Margin % as a column leads to misleading totals.

Having recommended that generally measures be used over columns, there certainly are circumstances where calculated columns are appropriate. One example is calculating Margin % as a column in order to group countries by High, Medium and Low Margin %. By writing an additional IF statement using the Margin % column, I can group countries by profitability:
= IF (Sales [Margin %] <=0.2, "Low",
IF (Sales [Margin %] <=0.3, "Medium",
"High"))
The discussion about whether to use calculated measures or columns highlights the importance of context and critical thinking in building Power BI reports. While adding additional columns may feel natural to Excel users, in many cases it yields misleading or inaccurate results. Analysts need to clearly understand the intended use of a metric, the context in which it’s applied, and how to write the DAX to achieve valid outputs.
Conclusion
The concepts discussed in this series are quite basic to experienced Power BI users. However, for analysts who have never been exposed to Power BI or databases like SQL, they are probably unknown or only partially understood. Without a sound comprehension of these foundational principles, working with Power BI is very difficult. Skilled excel users bring a great deal of applicable knowledge when they start using Power BI. With mastery of the concepts detailed in this post, analysts will rapidly accelerate their Power BI learning curve.
Questions or feedback? Reach out to jeff@bc-bi.com
Comments